
Twin Villages Economic & Demographic Data Package
Selected Economic & Demographic Data for the Twin Villages Area
The information on this page was compiled to support the Twin Villages Business Forum on Friday, September 22nd 2017. The Twin Villages Area for this forum was defined as consisting of Damariscotta, Newcastle, Nobleboro, Bristol, and South Bristol. Much of the economic and demographic data is from the U.S. Census Bureau, American Factfinder, 2015. The base map is from the Maine Office of GIS, Office of Information Technology. Labor Force, Unemployment, Total Wages and Establishment data is from Maine Department of Labor, Center for Workforce Research and Information, July 2017. Taxable Retail Sales data is from Maine Office of Policy and Management, State Economist. Housing data is from the Maine State Housing Authority.
Please contact Harold Spetla at 207-882-5986 or hspetla@lcrpc.org if you have questions or comments on the data provided.
Selected Economic & Demographic Data for the Twin Villages Area
Age Distribution
|
|
Age Distribution (percent ) |
|
|||
|
|
|
Under 20 yrs old |
20—64 |
65 yrs + |
|
|
|
TV Area |
18.4% |
52.9% |
28.7% |
|
|
|
Lincoln Cty |
19.5% |
56.2% |
24.3% |
|
|
|
Maine |
22.4% |
60.0% |
17.6% |
|
The above table contains data on the distribution of populations in the Twin Village area, Lincoln County, and Maine. The link below contains the Microsoft Excel dataset from which this table was created. Acquired from American Community Survey 5 Year Estimates.
Economic and Demographic Data
|
|
|
Damariscotta |
Newcastle |
Bristol |
Nobleboro |
South Bristol |
Lincoln Cty |
Maine |
|
|
|
Median HH Income |
$45,263 |
$60,966 |
$49,688 |
$52,417 |
$51,705 |
$50,462 |
$49,331 |
|
|
|
Households by Percent of General Income Type |
|
|
|
|
|
|
||
|
|
Earnings |
67.5% |
77.5% |
65.5% |
75.9% |
71.5% |
71.6% |
74.8% |
|
|
|
Social Security |
39.8% |
37.3% |
55.5% |
38.7% |
59.5% |
43.3% |
35.1% |
|
|
|
Retirement |
24.2% |
22.0% |
31.5% |
23.5% |
26.1% |
23.0% |
19.5% |
|
|
|
Labor Force (7/17) |
927 |
916 |
1319 |
1041 |
438 |
18,607 |
|
|
|
|
Unempl Rate (7/17) |
3.8% |
2.9% |
3.4% |
2.3% |
3.4% |
3.1% |
3.5% |
|
|
|
Educational Attainment (Percent of Residents with Bachelors Degree or Higher |
|
|
||||||
|
|
|
38.9% |
49.7% |
32.2% |
33.9% |
43.4% |
31.2% |
29% |
|
This table pertains to income, income type, labor force and unemployment, and level of education for the five towns in the Twin Village Area, Lincoln County, and Maine. Access to the Excel dataset is provided in the link below. Data obtained from Maine State Housing Authority, ACS 5 Year Estimates, and Maine Department of Labor, Center for Workforce Research and Information.
Selected Economic and Demographic Data
Taxable Retail Sales
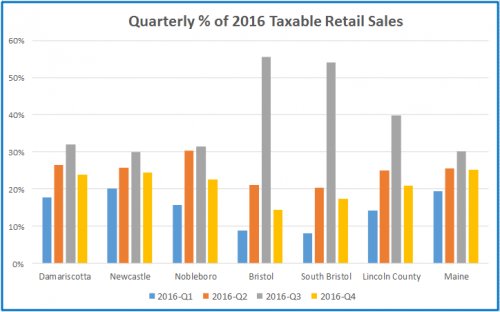
The chart above displays the quarterly breakdown of taxable retail sales throughout the five Twin Village Area towns, Lincoln County, and Maine.
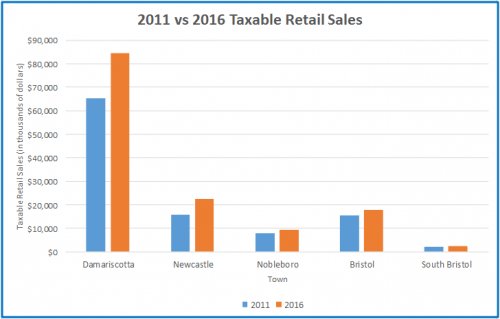
The about chart displays total taxable retail sales from 2011 and 2016 in thousands of dollars across the five towns in the Twin Villages Area. This is useful when comparing total gross taxable retail sales between towns, as well as, a glimpse of economic growth over that five year period.
The link below contains the dataset from which the above charts were derived.
Major Industries
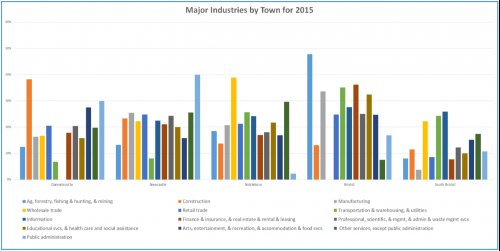
The above chart contains industry information for the Twin Village Area provided by the 2015 ACS Selected Population Tables. The chart demonstrates variations between the five towns in the Twin Villages Area.
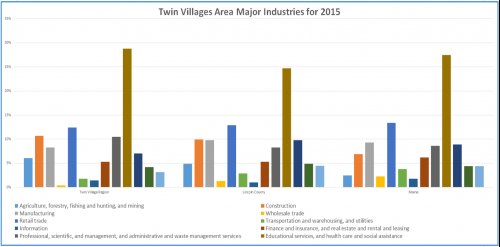
This chart offers a comparison of major industries between the Twin Villages Area, Lincoln County, and Maine. The link below provides access to the data contained within these charts.
Occupations
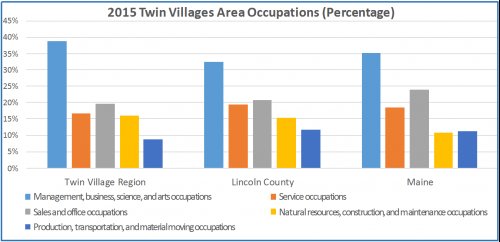
The above chart presents information comparing common occupation sectors between the Twin Villages Area, Lincoln County, and Maine. This data was obtained from the 2015 ACS 5 Year Estimates. The link below provides access to the Excel spreadsheets used to construct the chart.
Business Establishments and Industry Wages
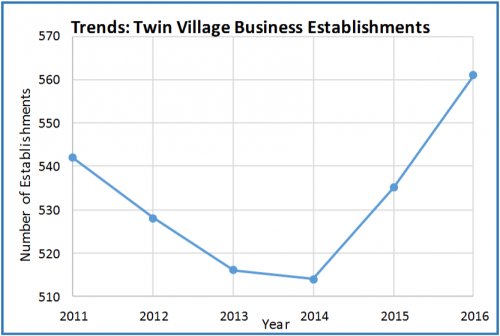
This graph above depicts the trend of business establishments from 2011 to 2016 in the Twin Villages area.
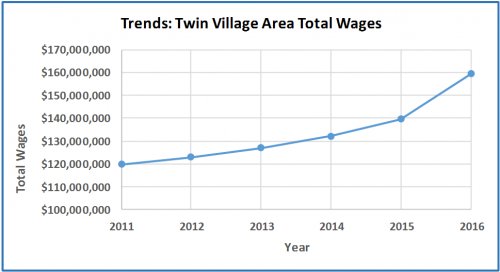
This graph displays the upward trend of total wages within the Twin Village area from 2011 to 2016. The data was acquired through the Maine Department of Labor, Center for Workforce Research and Information (CWRI) - 2016 Annual Totals. The Excel dataset can be accessed through the link below.
